Boxplot
A basic boxplot on the different variables of hydrochemistry visualises the range and variability of our chemistry (Fig.3). As certain variables in our chemistry have a greater natural variability in range than others or were measured in different units, all my variables need to be normalised. This was done by use of the ‘Standard Score’:
z=(x- μ)/σ
where z represents our standard score and its absolute value represents the distance between the raw score and the population mean in units of the standard deviation, x represents the raw value of the variable and sample in question, µ is the variable’s mean and σ its standard deviation. Having normalised all of my chemistry variables that will be put into question, their Standard Scores were used in further analyses, as this enables me to compare all of my chemistry in a single analysis, despite them having different normal distributions.
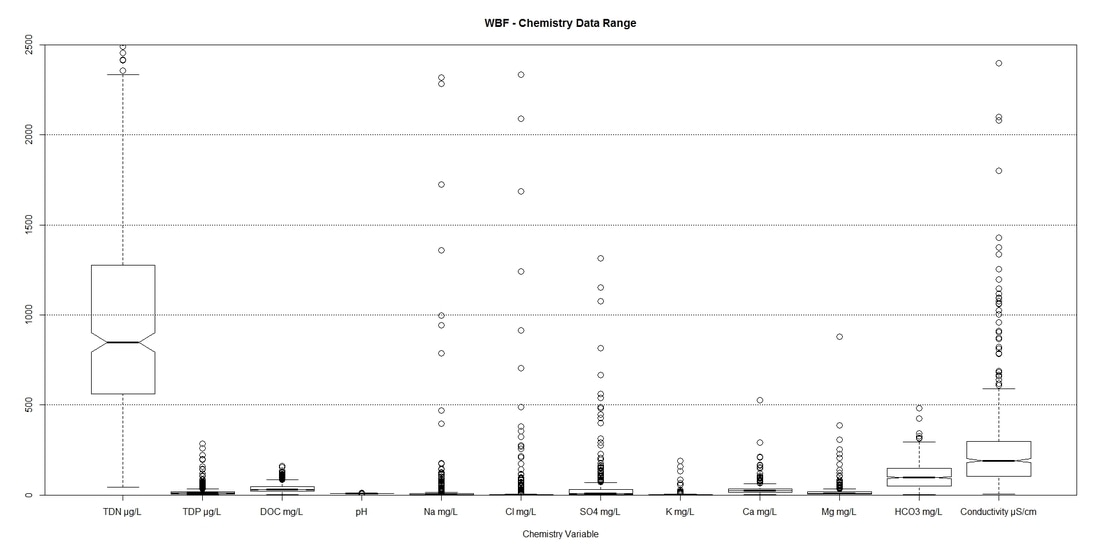
Fig.3: Notched boxplots of all chemical variables included in further analyses. The boxes capture all data within the 25th to 75th percentile, while the notches indicates the center 50% of the data. Whiskers capture the upper and lower 25 percentile of the data.
Principal Component Analysis (PCA)
Two separate Principal Component Analyses (PCA) where performed to highlight the variability of the sampled ponds. The first PCA was created based on the pond hydrochemistry (Fig.4-A) at the level of Canadian Ecozones (Fig.2). This PCA clearly shows that there is a significant overlap and similarity in pond hydrochemistry across the Western Boreal Forest, but with extremes in chemistry in the Boreal Cordillera and Boreal Plains. A second PCA was performed on the landscape controls (Table 1), again at the level of Canadian Ecozones (Fig.4-B). This second analysis shows that, while pond hydrochemistry is quite similar across the Western Boreal Forest, the landscape drivers influencing the chemistry show little overlap and are quite distinct. Based on these PCAs I conclude that there are distinct regions of extreme chemistry in the Boreal Cordillera and Boreal Plain. Furthermore, I expect that, while similar in chemistry, the landscape controls influencing the variability in hydrochemistry will differ between distinct regions.
As the hydrochemistry PCA (Fig.4-A) shows a split between the geochemistry variables (electrical conductivity (EC), ion concentrations and pH) and pond nutrients along the first and second principal component, this indicates there is no real connection between the two collections of chemistry. Based on this, the analyses following will focus on the variability in geochemistry and nutrients separately.
As the hydrochemistry PCA (Fig.4-A) shows a split between the geochemistry variables (electrical conductivity (EC), ion concentrations and pH) and pond nutrients along the first and second principal component, this indicates there is no real connection between the two collections of chemistry. Based on this, the analyses following will focus on the variability in geochemistry and nutrients separately.
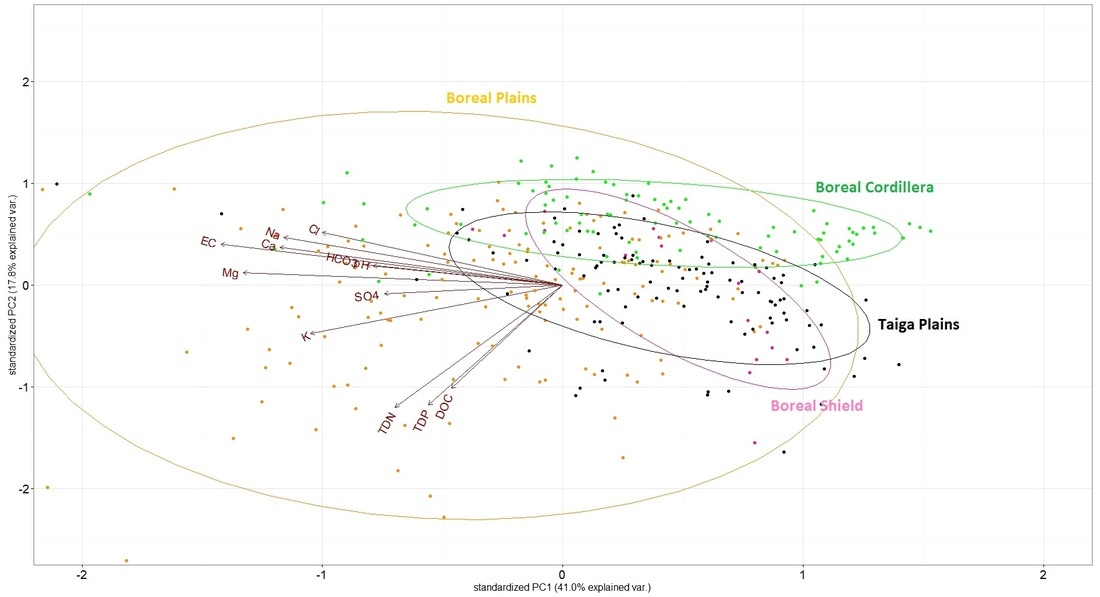
Fig.4-A: Principal Component Analysis on the pond hydrochemistry variables. The main groups were identified based on the Canadian Ecozones the ponds were located in.
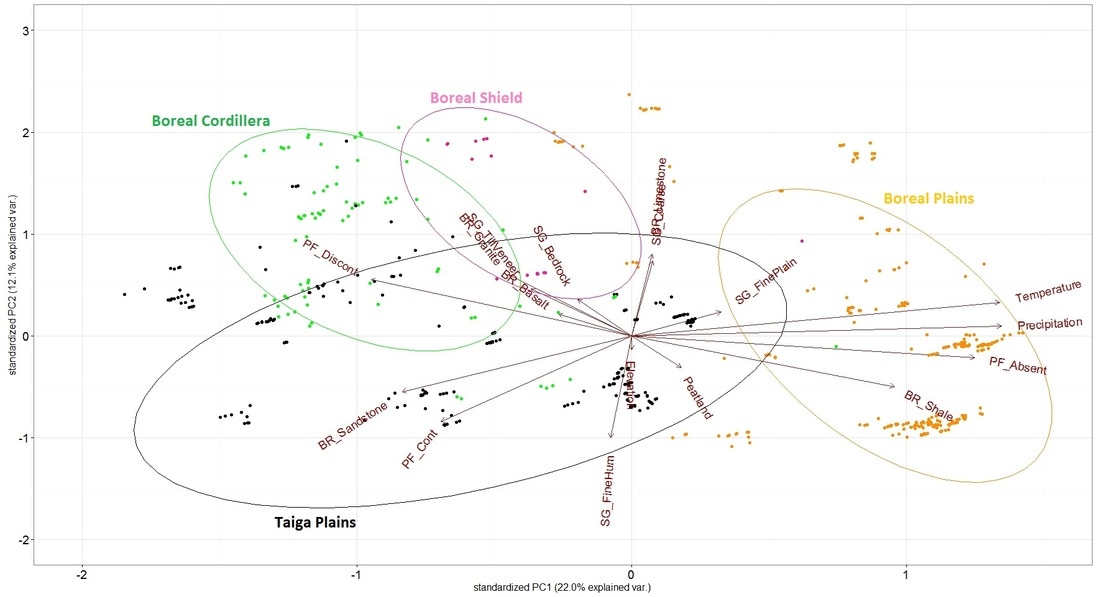
Fig.4-B: Principal Component Analysis on the landscape drivers that the sampled ponds were located in. The main groups were identified based on the Canadian Ecozones.
